1. Why Oil Feels Like the Wild West of Trading
If you’ve ever watched crude oil charts during a major news event, you know exactly what chaos feels like. One minute oil is sprinting upward like it’s late for a meeting, and the next minute it’s dropping as if someone pulled the floor out from under it. And the craziest part? It’s normal. Oil is the kind of market that doesn’t like sitting still. It reacts to politics, storms, wars, elections, OPEC meetings, even tweets. If gold moves like a seasoned marathon runner, oil moves like an over-caffeinated sprinter who doesn’t know what pacing means. This volatility is terrifying for some people… But for active traders, it’s where the money is.
2. What Exactly Is Oil Price Volatility?
Let’s skip the academic jargon and keep this simple. Oil price volatility is basically how dramatic oil can be. Sometimes it behaves, slowly drifting. Other times it throws tantrums and shoots up or down like it’s on a trampoline. A “volatile” market means:
- Prices move fast
- Prices move big
- Prices move often without warning
For traders, this means opportunity. For beginners, this means “please use a stop-loss, seriously.”
3. The Real Reasons Oil Moves So Much
Oil doesn’t move randomly. It feels random when you’re watching the candles jump around in real time, but behind the scenes, there’s always something stirring the pot. Here’s what usually does it:
A. Supply and Demand Drama
If the world needs more oil, prices go up. If there’s too much oil floating around, prices go down. But because oil is tied to everything - travel, manufacturing, shipping, heating - the demand side can change quickly, sometimes overnight.
B. OPEC’s Decisions
When OPEC+ whispers “production cuts,” prices usually rise. When they whisper “increased output,” prices fall. Oil traders watch these meetings like football finals.
C. U.S. Crude Oil Inventories
Every Tuesday and Wednesday, traders wait for the API and EIA inventory reports. These reports alone can create 100-200 pip moves in seconds. It’s like a weekly oil market lottery.
D. Geopolitical tension
If something happens in the Middle East, even a rumor, oil reacts instantly. Pipeline attacks, sanctions, military standoffs - oil markets are way too sensitive.
4. The Emotional Side of Oil Trading No One Talks About
Oil is one of the few markets that forces traders to confront their emotions head-on. Fear, greed, hesitation, revenge trading - oil exposes everything. Why? Because the market moves so quickly that:
- You don’t have time to “think about it later.”
- You can’t sit on your hands too long.
- You either act or the moment is gone.
It keeps traders honest. Sometimes brutally honest.
5. A Simple Way to Read Oil Trends Without Overthinking
Here’s one of the most human-friendly ways to understand oil trends:
- Zoom out to the daily chart
- Ask yourself, literally: “Is this thing mostly going up, going down, or going sideways?”
- Don’t overcomplicate it.
If the overall direction is up, look for buying opportunities. If it’s down, look for selling setups. If it’s sideways, take a walk or trade the range carefully. Oil rewards simplicity more than people expect.
6. Why Active Traders Love Volatile Oil Prices
It’s simple: volatility equals opportunity. You don’t have to wait days for a decent move. Sometimes all you need is:
- one strong news event,
- one inventory release,
- or one OPEC press conference
… and suddenly the market moves enough to make your entire day. For active traders who like momentum, speed, and clear direction, oil is like a playground. Of course, playgrounds still have hard floors - risk is real, and we’ll talk about that soon.
7. The Technical Patterns That Actually Work on Oil
Oil respects certain technical structures surprisingly well.
A. Support and Resistance Zones
These levels on crude oil get hit again and again. When they break, they break hard.
B. Trendline Retests
Oil almost loves retesting a trendline before continuing. It’s like the market double-checks its momentum.
C. EMA Reactions
The 50 EMA and 200 EMA on oil charts? They’re like magnets. If you’re stuck, start watching how crude interacts with moving averages - you’ll begin to see patterns that look almost predictable.
8. How Traders Use Multi-Timeframe Analysis in Oil
A lot of traders make this too complicated. Here’s a simpler, more human version:
- Daily chart: What’s the big story?
- 4H chart: What’s happening this week?
- 1H chart: Where can I enter?
- 15M chart: Is the timing right?
That’s it. No need for 7 timeframes and 14 indicators. The market doesn’t reward confusion.
9. The News Events That Make Oil Go Crazy
If you want to trade volatile oil prices, you MUST know the schedule. Here are events that can transform the chart instantly:
- EIA Inventory Reports
- OPEC Meetings
- Fed Rate Decisions
- Middle East geopolitical updates
- Hurricane season (Gulf of Mexico production risk)
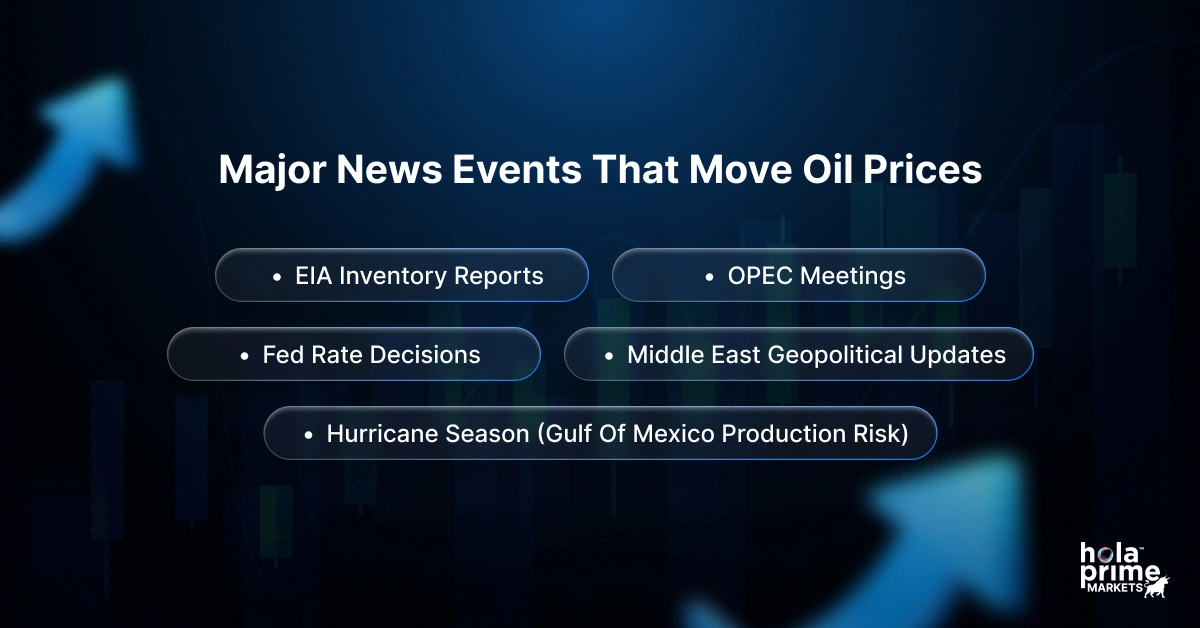 Some traders avoid these times entirely. Others wait specifically for them. Either approach is valid. Just don’t blindly trade - oil during news can be a rollercoaster.
10. The Beginner Mistakes That Blow Up Oil Accounts
Let’s be brutally honest here. Most traders who fail in oil trading make the exact same mistakes:
- Trading without stops
- Using too much leverage
- Chasing after big candles
- Getting emotional after losing a trade
- Holding losing positions “hoping” it will reverse
- Forgetting that news can make spreads widen instantly
If you eliminate just these mistakes, you’re already ahead of half the market.
11. Understanding Where Oil Really Gets Its Momentum From
Here’s the thing about crude oil: It rarely moves “just because.” There’s usually a spark - something that gives it the energy to break out of a range or reverse a trend. A few real-world examples:
- A random comment from a Saudi energy minister → suddenly WTI spikes.
- A surprise draw in inventories → bulls pile in.
- A recession fear headline → everything drops like a stone.
Momentum in oil is emotional. It’s a reaction-driven market. This is why active traders who watch fundamentals and price action tend to notice momentum shifts way earlier than those who only stare at charts.
12. The Beauty (and Danger) of Oil Breakouts
Oil is famous for breakouts that don’t waste time. When it breaks a level, it usually does it with conviction - big candles, big volume, no hesitation. But here’s the trap: Oil also loves fakeouts. You might see a breakout candle that looks perfect… Then the next candle slams right back inside the range and wipes out anyone who FOMO’d their way in. How to avoid getting trapped?
- Wait for retests
- Look for strong volume
- Don’t enter just because the candle “looks big”
- Use smaller position sizes during news periods
Breakouts in oil are profitable - but only when you stay patient enough to avoid the fake ones.
13. Why Pullbacks Are a Gift to Oil Traders
Pullbacks are underrated in fast markets. Most people see a strong move and think, “Damn, I missed it.” But the truth is, in oil, pullbacks are where the real money is made because they offer:
- clean entries,
- clear invalidation levels,
- and much lower risk compared to chasing the breakout.
A simple rule many oil traders follow: If oil is trending, the first clean pullback is usually the safest entry. It’s not fancy. It’s not complicated. But it works more often than not.
14. The Relationship Between Oil and the U.S. Dollar
People often hear, “Oil is priced in dollars,” and assume that’s the whole story. But the dollar-oil relationship is more dynamic. Here’s the simplest way to understand it:
- When the dollar strengthens, oil usually weakens.
- When the dollar weakens, oil usually rises.
Why? Because if the dollar gets stronger, it becomes more expensive for other countries to buy oil → lowering demand. It’s not a perfect inverse relationship, but it’s strong enough that traders watch the USD index (DXY) like a weather report.
15. How Traders Use Inventory Reports to Predict Oil Moves
Oil inventory reports are like exam results for traders - everyone is nervous before they drop. Here’s why they matter:
- If inventories increase, it usually means lower demand → bearish
- If inventories decrease, it means higher demand or lower supply → bullish
But the key isn’t the number itself. It’s whether the number matches expectations. For example:
- Expected: -2M
- Actual: -5M → That’s a bullish surprise.
Traders who understand this nuance react faster and with more confidence.
16. Trading Oil During Geopolitical Tension
Let’s be real - this is the riskiest part of oil trading. Geopolitical events don’t follow logic. They don’t care about technical analysis. They don’t care about structure. They don’t care about your perfect trendline. A single headline can shoot oil up 300–500 pips in minutes. If you want to trade geopolitics-driven moves:
- watch news flow closely,
- reduce position size,
- avoid holding trades overnight,
- and remember that uncertainty cuts both ways.
Some traders love this volatility. Others avoid it entirely. Both approaches are valid - just know what kind of trader you are.
17. Why Oil Traders Obsess Over Support and Resistance Levels
Support and resistance aren’t just lines on a chart - they’re psychological barriers. Every trader sees them. Big players. Retail traders. Algorithms. This shared attention makes these levels powerful. In oil, these zones often behave like this:
- Approach the level: Market slows down
- Break the level: Market speeds up
- Retest the level: Traders jump in
- Reject the level: Trend reverses
If there’s one skill new oil traders should master first… It’s marking clean support and resistance zones. Everything else builds on that.
18. Using Simple Indicators Without Overcomplicating Your Chart
A lot of new traders make their charts look like a spaceship control panel. Too many indicators kill clarity. Oil doesn’t need complicated setups. Professional traders usually rely on just a few:
- EMAs (trend direction)
- Volume (strength of moves)
- ATR (volatility)
- RSI (momentum and exhaustion)
Most of the best oil trades are based on price action first, indicators second.
19. Why Multi-Timeframe Confluence Makes Your Trades Safer
Confluence means “multiple signals pointing in the same direction.” For example:
- Daily trend is bullish
- 4H chart shows a pullback
- 1H chart shows rejection at support
- 15M shows a bullish engulfing
That’s confluence. You don’t need to be a genius. You just need to stack the odds in your favor. This is how professional oil traders stay consistent. They don’t gamble. They combine signals.
20. How to Survive Oil’s Sudden Reversals Without Losing Your Mind
The biggest frustration for oil traders is getting caught in sudden reversals - especially after a clean setup. Here’s what seasoned traders do to avoid unnecessary damage:
- Trade smaller during high volatility
- Use soft targets - take partial profits
- Don’t assume momentum will last forever
- Avoid entering right after huge candles
- Take breaks after big moves
Oil is fast. It reverses fast. The trick is not to overcommit emotionally or financially on any single trade.
21. The Art of Timing Entries in a Fast-Moving Oil Market
Timing in oil trading is almost everything. You can be right about direction but still lose money if your entry is off by even a few minutes - that’s how quickly crude can move. Most traders make the mistake of entering:
- too early (before confirmation)
- or too late (after the move already happened)
Here’s what usually works better:
- Wait for the candle to actually close, not just look promising.
- Focus on rejection candles at key levels (wicks tell a story).
- Don’t rush just because oil twitched - it fakes out impulsive traders on purpose.
Oil rewards patience way more than it rewards speed.
22. The Smart Way to Use Stop-Losses in Oil
Some traders think stop-losses are a sign of weakness. In oil trading, they’re a sign of intelligence. The market’s too unpredictable not to use them. But here’s the trick most people miss: A good stop-loss is not “where you hope price won’t go.” It’s placed at the point where your idea is proven wrong. The difference is huge. For example:
- A stop-loss below strong support is logical.
- A stop-loss placed randomly “because it feels safe” is emotional.
Oil doesn’t care about feelings.
23. Why Traders Should Avoid FOMO More Than Anything Else
Oil is incredibly good at triggering FOMO. You see a massive candle. You panic. You enter. You immediately regret your life choices. Oil punishes emotional decisions almost instantly. A few reminders that help:
- If you missed the move, another one will come.
- Big candles usually mean the move is almost done.
- The best trades happen on pullbacks, not peaks.
If you remove FOMO from oil trading, your accuracy shoots up without changing anything else.
24. Learning to Read Oil Candlesticks Like Market Emotions
Candlesticks on oil charts are basically mood swings visualized. A few patterns tell you a LOT about what traders are thinking:
- Long wicks = uncertainty or rejection
- Engulfing candles = momentum shift
- Doji candles = hesitation
- Big-bodied candles = aggression
Oil tends to exaggerate emotions. When you learn to read candle behavior, you start seeing patterns you never noticed before. It becomes less like “random movement” and more like “oh, this candle is showing fear” or “that candle is showing strength.”
25. The Hidden Influence of Seasonality on Oil Prices
Most new traders don’t know this, but oil actually has seasonal tendencies - especially in the U.S. For example:
- Hurricane season can disrupt Gulf of Mexico production → prices rise
- Winter increases heating oil demand → more volatility
- Summer driving season boosts fuel consumption
It’s not a perfect science, but when you know the seasonal patterns, sudden moves make a lot more sense.
26. Hedging: The Grown-Up Way to Trade Oil Volatility
Not every trader wants to swing for the fences. Some want controlled, calculated growth. That’s where hedging comes in. Hedging is basically placing a second position that reduces the risk of your first position. For example:
- If you’re long oil but news could shake the market, you open a smaller short position to protect yourself.
This doesn’t mean you eliminate risk - you just keep it manageable. Professional traders hedge all the time. Retail traders almost never do. That’s why retail accounts blow up more often.
27. Using Options to Trade Oil Volatility
People hear “options trading” and panic because it sounds complicated. But when it comes to oil, options can actually make things safer, not riskier. Here’s the simple version:
- If you think oil will move big, but don’t know which direction, you buy a straddle (call + put).
- If you think oil will stay calm, you sell a strangle (but this requires skill and experience).
Options let you profit from volatility itself - not just price direction. That’s why many advanced oil traders rely on them during chaotic markets.
28. Understanding When NOT to Trade Oil
This is one of the most human and most important lessons in oil trading. Sometimes the best trade is no trade. Here are situations where sitting out is the smartest move:
- When price is stuck in a tight, boring range
- When you’re tired, emotional, or unfocused
- Right before unpredictable news
- After a big losing streak (take a break)
- When spreads skyrocket during volatility
Oil can be dangerous when you’re not mentally sharp. Even the best strategy won’t save you from bad mental states.
29. Building Your Own Customized Oil Trading Plan
You shouldn’t trade oil the same way someone else trades it. Your plan should match:
- your personality
- your risk tolerance
- your schedule
- your emotional strengths and weaknesses
A simple oil trading plan includes:
- Your preferred timeframes
- Your technical tools
- Your rules for entries and exits
- Your position sizing
- Your maximum daily loss limit
- Your documentation process
Having a plan doesn’t guarantee profit - but it prevents chaos, and that’s half the battle in oil trading.
30. The Role of Experience and “Screen Time” in Oil Trading
Oil trading is one of those activities you can’t fully learn from books or YouTube alone. You need screen time - hours of watching how it moves. Over time, you start noticing:
- the way it behaves during Asia vs. London vs. New York
- how it reacts before inventory reports
- the “rhythm” of certain trends
- when volume tends to kick in
- how it behaves around psychological levels like $70, $80, $90
Experience sharpens instincts. It quiets the noise. It makes you react calmly instead of panicking. There’s no shortcut for this part - but it’s absolutely worth the time.
31. Why Oil Loves to Fake Breakouts
Oil has a personality trait traders both love and hate: it pretends to break out, just to snap back and trap everyone. Here’s how it tricks you:
- It pushes above resistance → everyone buys
- Then it instantly reverses → stops get hit
- Then the real move begins in the opposite direction
Why does oil do this so often? Because liquidity lives above and below obvious levels. Big players hunt those levels before moving price in the real direction. Best way to avoid fake breakouts?
- Wait for a retest.
- Let price come back to the breakout zone.
- Enter after it confirms the level as support/resistance.
Patience saves accounts.
32. The Power of Psychological Price Levels ($70, $80, $90…)
Oil respects psychological levels more than most commodities. Why? Because hedge funds, banks, energy companies, and even governments pay attention to them. For example:
- $70 often acts as a “comfort zone”
- $80 becomes a danger zone for inflation fears
- $90 starts triggering geopolitical pressure
- $100 becomes a global headline
When oil approaches these rounded levels, volatility increases. Traders clump their orders there, which creates explosive reactions. If you trade oil, always mark these levels on your chart.
33. The Trick of Using Multiple Timeframes
The biggest mistake beginners make: They trade off just one timeframe. Oil needs a multi-timeframe approach because it’s fast. Signals appear and disappear quickly. Here’s the simple method:
- 4H → trend direction
- 1H → key zones and structure
- 15M → entry timing
- 5M → sniper confirmation (optional)
It’s like zooming in on a map: 4H shows the city. 1H shows the neighborhood. 15M shows the street. 5M shows the exact house. Once you layer them together, your accuracy jumps massively.
34. What Volume Really Tells You in Oil Trading
Oil volume tells you where the “serious money” stepped in. Low volume = noise. High volume = intention. A few volume truths that help:
- Sharp moves with low volume → likely fake
- Sharp moves with high volume → sustainable
- Rejections on high volume → strong counter-pressure
- Breakouts with low volume → unreliable
Volume is like a lie detector. It tells you when the move is real and when the market is exaggerating.
35. Understanding Oil’s Relationship With Inflation
Oil affects inflation. Inflation affects oil. It’s a loop that traders can use to their advantage. Here’s the simple version:
- Rising inflation → governments want oil lower
- Falling inflation → oil has more room to climb
- Strong CPI data → oil can spike
- Weak CPI data → oil can dump
Oil is basically a thermometer for global economic stress. When inflation headlines come out, don’t blink. Oil reacts instantly.
36. Why Inventory Data Moves Oil So Violently
Every week, oil traders brace themselves for one thing: The U.S. Crude Oil Inventory Report. This single report can create:
- instant spikes
- sudden dumps
- huge fakeouts
- spread widening
- stop-loss hunting
- breakouts out of nowhere
Why? Because inventories tell the world if supply is tightening or loosening. Low inventories → bullish. High inventories → bearish. But the trick is in the forecast vs. actual number. Even a small deviation can trigger chaos. Smart traders avoid opening new positions 15-30 minutes before the release.
37. The Link Between Gold and Oil
Gold and oil aren’t always correlated… but when they are, it usually signals something important. Typical patterns:
- When oil rises but gold falls → markets expect strong growth
- When oil falls but gold rises → fear is increasing
- When both rise → inflation concerns
- When both fall → global slowdown vibes
Watching gold gives you clues about oil’s next mood swing. It’s like listening to background music inside the market.
38. Trading Oil Based on Supply Disruptions
Whenever there’s talk of:
- refinery outages
- pipeline shutdowns
- storms
- political disputes
- production cuts
…oil reacts before the full details even emerge. Because in oil trading, perception becomes reality. If traders believe supply will fall, price moves immediately - long before any actual shortage happens. This is why reading headlines early gives you a huge edge.
39. How Market Sentiment Affects Oil
Oil isn’t just charts - it’s psychology. If the market “feels” uncertain, oil gets shaky. If the market “feels” confident, oil trends smoothly. Here’s how sentiment shows up:
- Fear → quick dumps, long wicks
- Greed → strong rallies, clean candles
- Confusion → choppy sideways movement
- Overconfidence → bubble-like spikes
- Panic → fast crashes
Understanding sentiment protects you from getting blindsided by sudden mood swings.
40. Developing a Calm Mindset for Oil Trading
Oil rewards traders who stay calm. If your emotions take over, oil will chew you up. A calm mindset helps you:
- exit bad trades quicker
- spot clean setups
- avoid revenge trading
- stick to your plan
- ignore random noise
- stay consistent during volatility
A simple technique that works wonders: Before every trade, ask yourself: “If this trade loses, will I still feel calm?” If the answer is no - reduce your position or skip the trade. Your mental state matters more than any indicator.
Conclusion
Oil will always be one of the most unpredictable, emotionally charged markets on the planet. It reacts to wars, storms, political speeches, inventory numbers, economic releases, supply rumors, and even sudden mood swings in global sentiment. That’s exactly what makes it both fascinating and challenging and why so many traders are drawn to it. But here’s the good news: Oil volatility isn’t your enemy. It’s your opportunity. If you understand:
- how supply and demand shift
- why news sparks violent moves
- where liquidity hides
- how big players hunt levels
- what technical patterns oil respects
- and when volatility tends to explode
…you stop feeling overwhelmed and start feeling prepared. You’ve now walked through dozens of real-world techniques - from supply-side analysis and geopolitical mapping, to volume reading, timeframe stacking, risk management, and psychological mastery. Every technique works on its own, but combined, they give you a complete system that helps you stay calm, intentional, and consistently profitable in a market that punishes impulsiveness. Remember this: Oil doesn’t reward the smartest trader - it rewards the most disciplined one. The trader who waits. The trader who reads the structure. The trader who respects their risk. The trader who stays patient when others chase noise. At the end of the day, trading oil is like surfing. You can’t control the waves. But you can learn how to ride them with skill, balance, and timing. If you continue studying the market, refining your setups, and managing your emotions, oil stops feeling like chaos and starts feeling like a rhythm - a rhythm you can understand, adapt to, and ultimately profit from. Your confidence grows. Your entries become cleaner. Your losses become smaller. Your wins become bigger. And your overall trading becomes more intentional than ever. Master oil’s volatility - and you master one of the most rewarding markets in the world.