When you look at global markets moving together – almost like they’re dancing to the same rhythm – that’s correlation at work. And if you’re a trader who loves spotting patterns, timing momentum, or simply making more informed decisions, understanding indices correlation can quietly become one of your biggest advantages.
Let’s break it down in a warm, simple, human way – so by the end of this, you’ll not only get the concept, but you’ll also know exactly how to use index relationships to find real opportunities.
1. What Does “Correlation Between Global Indices” Actually Mean?
Correlation is just a fancy way of saying:
“Do these markets tend to move in the same direction… or not?”
For example:
- If the S&P 500 goes up, does the Nasdaq 100 usually follow?
- When Europe is bearish (like the DAX or FTSE), does the US market usually soften too?
- What happens to Asian markets when Wall Street has a wild day?
Correlation captures these relationships using a number between –1 and +1:
- +1 → Move together perfectly
- 0 → No real relationship
- –1 → Move in opposite directions
Most major stock indices sit somewhere between +0.60 to +0.95 with each other – meaning, yes, the world is tightly linked.
2. Why Should Traders Care? (Especially Short-Term and Index CFD Traders)
Because correlation helps you:
-
Identify market sentiment early
If European markets open deeply red, it often sets the tone for the US session.
-
Avoid overexposure
You might think you’re diversified…
But if you’re long the S&P 500, Nasdaq 100, and Dow Jones, you’re basically holding three versions of the same trade.
-
Spot high-probability setups
Some indices lag behind.
Some lead.
Knowing this creates opportunities.
-
Confirm your bias
If everything is pointing in the same direction, momentum becomes more trustworthy.
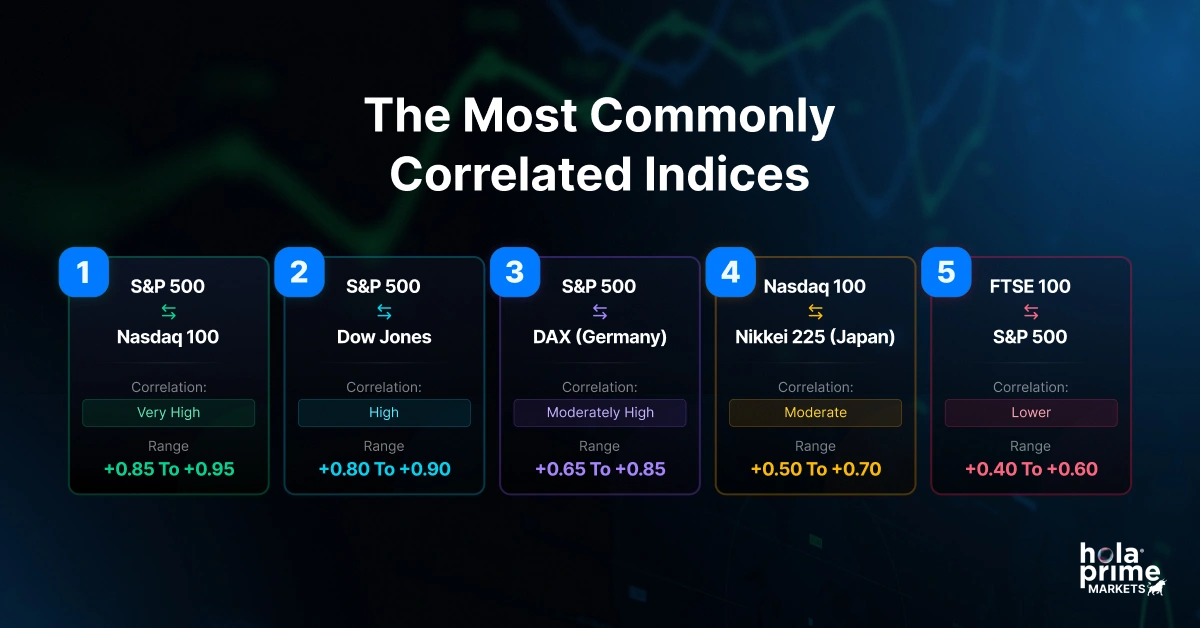
3. The Most Commonly Correlated Indices (and Why They Move Together)
Here’s the simple truth:
Global markets are connected by news, sentiment, interest rates, earnings cycles, and capital flow.
So naturally, some markets tend to mirror each other.
1. S&P 500 ↔ Nasdaq 100
Correlation: Very High (+0.85 to +0.95)
Why?
Both represent large U.S. stocks, and mega-cap tech influences both.
2. S&P 500 ↔ Dow Jones
Correlation: High (+0.80 to +0.90)
Why?
Both track U.S. large-cap companies, just weighted differently.
3. S&P 500 ↔ DAX (Germany)
Correlation: Moderately High (+0.65 to +0.85)
Why?
Germany’s economy is export-heavy and sensitive to U.S. corporate performance.
4. Nasdaq 100 ↔ Nikkei 225 (Japan)
Correlation: Moderate (+0.50 to +0.70)
Why?
Japan has a big technology sector, making it responsive to U.S. tech moves.
5. FTSE 100 ↔ S&P 500
Correlation: Lower (+0.40 to +0.60)
Why?
FTSE is heavily influenced by commodities and the British pound – different drivers.
4. Where Correlation Creates Trading Opportunities
Correlation isn’t just a fun statistic – it’s practical.
Here’s how to turn it into strategy.
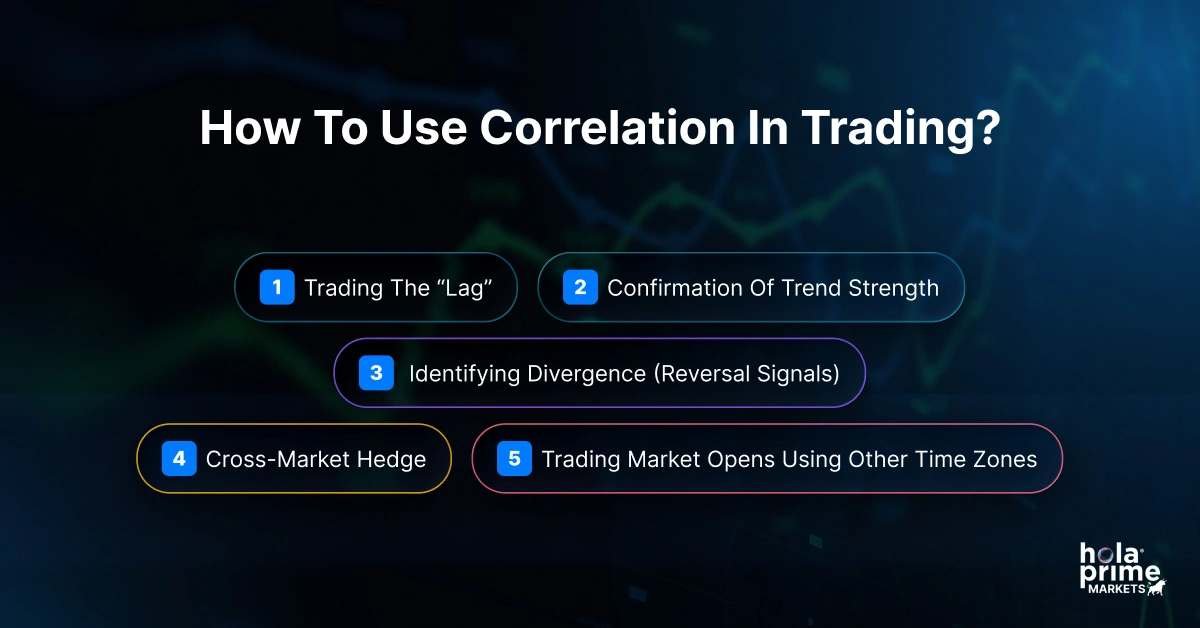
Opportunity 1: Trading the “Lag”
Sometimes one index moves sharply while others take time to catch up.
Example:
- Nasdaq 100 jumps after strong tech earnings
- S&P 500 stays flat
- Dow barely reacts
Traders often position in the lagging index, expecting it to follow.
Opportunity 2: Confirmation of Trend Strength
If all U.S. indices – S&P, Nasdaq, Dow – are aligned, it gives confidence that:
- Momentum is real
- Breakouts are valid
- Pullbacks are temporary
This works beautifully for intraday trend trading.
Opportunity 3: Identifying Divergence (Reversal Signals)
When one index pushes higher but others don’t confirm, it can warn you:
- A reversal is coming
- The trend is weakening
This is incredibly useful for short-term scalpers trading Nasdaq 100 or S&P 500 CFDs.
Opportunity 4: Cross-Market Hedge
If markets are highly correlated, you can:
- Hedge using a related index
- Reduce risk without closing your position
Example:
Long Nasdaq, hedge via short S&P 500 if volatility spikes.
Opportunity 5: Trading Market Opens Using Other Time Zones
A classic example:
- Europe’s DAX collapses in early trading8
- Traders anticipate a weak U.S. open
Correlation helps you understand that sentiment flows between sessions, creating predictable waves.
5. A Simple Indices Correlation Table (For Quick Reference)
| Index Pair | Correlation Strength | Notes |
| S&P 500 ↔ Nasdaq 100 | Very High | Tech-driven connection |
| S&P 500 ↔ Dow Jones | High | Large-cap overlap |
| S&P 500 ↔ DAX | Medium–High | U.S.–EU economic links |
| Nasdaq 100 ↔ Nikkei 225 | Medium | Tech influence |
| FTSE 100 ↔ S&P 500 | Medium–Low | Currency & commodities impact |
(Values vary, but relationships are consistent.)
6. When Correlations Break And Why It Matters
Correlations aren’t permanent.
They can weaken during:
- Major earnings seasons
- Interest rate surprises
- Geopolitical shocks
- Currency volatility
- Sector rotation
When correlation breaks, volatility gets messy but trading opportunities increase.
For example:
If Nasdaq rallies on tech strength, but Dow drops on industrial weakness… you’re witnessing a sector rotation in real time.
Smart traders capitalize on these disconnections.
7. How You Can Use Indices Correlation Today
Here’s a simple checklist you can follow every day:
-
Start by scanning global opens
Look at Asia → Europe → U.S.
Momentum often carries.
-
Compare U.S. index futures pre-market
If S&P, Nasdaq, and Dow all point in the same direction, the open is often predictable.
-
Watch for divergences
When two correlated indices disagree, something big is happening underneath.
-
Avoid stacking correlated positions
Going long on multiple U.S. indices isn’t diversification – it’s magnified exposure.
-
Use correlation to time entries
If your trading index is lagging behind others, it may give you a better entry.
8. Final Thoughts
Once you understand how global indices move together, the market starts making a lot more sense. You begin to see patterns early. You understand sentiment better. You avoid unnecessary risk. And most importantly…
You discover opportunities that other traders simply overlook.
Correlation isn’t complicated – it’s just about noticing how the world connects.
Use it with your existing strategies, and you’ll start feeling more confident, more prepared, and far more in sync with the markets you trade every day.